
Monthly EV Minute: July 2024
Sept. 13, 2024

Welcome back to our monthly update series that provides the latest developments on EV sales, EV user satisfaction, and EV charging growth based on comprehensive, nationally recognized data sources.
Below are the key take-aways from latest available information.
EV Sales
According to Argonne National Laboratory, plug-in electric vehicles (PEVs) captured 9.7% of total light duty vehicle (LDV) sales in July 2024, up from 9.1% in June 2024. PEVs include both battery electric vehicles (BEVs) and plug-in hybrid electric vehicles (PHEVs).
- As of the end of July 2024, cumulative PEV sales in 2024 were 847,287.
- For context, at the end of July 2023, cumulative PEV sales were 664,111. In other words, 180,000+ more PEVs have sold in 2024 than at this same time last year.
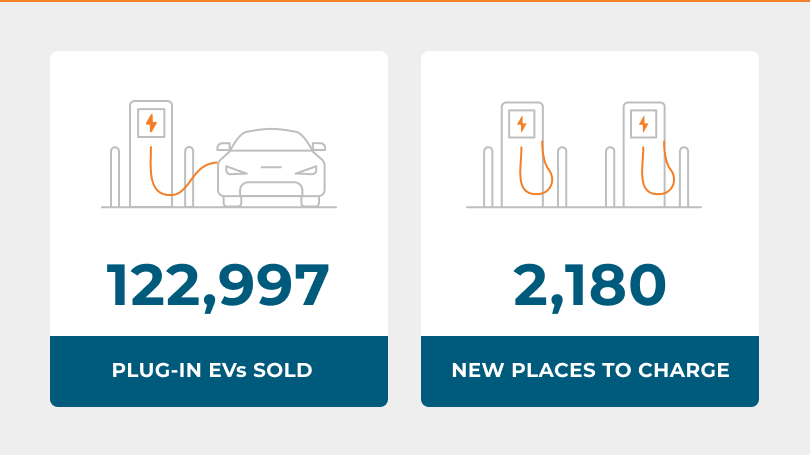
- A total of 122,997 PEVs (100,677 BEVs and 22,320 PHEVs) were sold during July 2024 in the United States, down 1.2% from the sales in July 2023.
- A total of 1,273,115 light-duty vehicles were sold in the United States during July 2024, down 2.0% from the sales in July 2023.
- In total, 5,571,526 PEVs have been sold since 2010 in the United States.
Source: Light Duty Electric Drive Vehicles Monthly Sales Updates - Argonne National Laboratory
EV Consumer Interest, Availability, and Affordability
Consumers are taking advantage of the federal tax credits from the Inflation Reduction Act with over $1 billion in upfront cost savings since Jan. 1, 2024. New EV models are now available that meet the needs of mainstream consumers.
- JD Power EV Index data from July indicates that 65.5% of buyers now have a viable EV alternative to their current internal combustion engine (ICE) vehicle.
- Leasing and purchasing an EV continues to be more affordable than leasing or purchasing an ICE vehicle, with JD Power EV Index data from July showing an affordability score of 102.8 (with 100 representing parity with ICE vehicles), representing a 6.6-point year-over-year increase.
- JD Power EV Index data from July indicates that leasing is more affordable than purchasing an EV, nearly 8 points higher on the affordability score (108.2 compared to 100.3) based on total cost of ownership modeling. Leases comprise 28% of the overall EV fleet mix.
- In June, the Chevrolet Equinox EV entered the market, which has an advertised MSRP of $41,900 and qualifies for the $7,500 EV tax credit, offering the potential for significant savings over the lifetime of the vehicle.
EV Charging
Charger Growth
- From July 1 to July 31, an additional 2,180 charging ports came online, representing a 1.2% increase in our national charging network.
- See these growth trends for yourself at driveelectric.gov/stations-growth.
Charger Utilization
- Stable Auto collected data from 47,000 non-Tesla chargers across the country and found that DC Fast Charger (DCFC) utilization is up 32%, growing from an average of 12.9% in July 2023 to 17.1% in June 2024.
- Level 2 charging utilization likewise increased from 13.3% in July 2023 to 14.5% in June 2024.
National Charging Network Size
- The national charging network has doubled since 2021!
- There are more than 193,000 charging ports available across every state in more than 71,000 locations as of today.
- For real-time data and to find chargers, visit driveelectric.gov/stations. "
Source: Alternative Fuels Data Center: Electric Vehicle Charging Infrastructure Trends